Landslide Hazards.
After starting my career using satellite imagery to study the moons of Jupiter, I transitioned into using satellite and aerial imagery to study Earth. What was I looking at? Landslides.
In addition to the landslides, I've also studied their affect downstream.
In addition to the landslides, I've also studied their affect downstream.
LANDSLIDES
SOBIESZCZYK, STEVEN, and Kean, J.W., 2022, Postfire debris flow hazards—Tips to keep you safe: U.S. Geological Survey Fact Sheet 2022-3078..
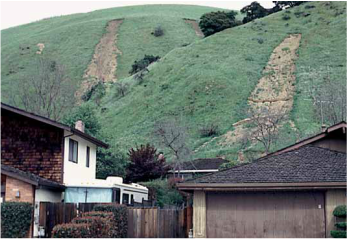
Often referred to as “mudflows,” debris flows are a type of landslide made up of a rapidly moving mixture of dirt, rocks, trees, and water (and sometimes ash) that start on a hillside and travel downvalley. They can easily overflow channels and severely damage houses, vehicles, or other structures. Areas burned by wildfires are especially susceptible to these hazards, which can be triggered by storms occurring days to years after a fire. Debris flows in burned areas can start on a dry slope after only a few minutes of heavy rainfall—about half an inch an hour or more. They can also threaten unsuspecting areas downstream, as debris flows can travel many miles and affect places that were neither burned nor received any rain.
SOBIESZCZYK, STEVEN, Ashland, F., Martinez, S. and Schwab, R., 2020, Vicksburg National Military Park: 2020 Landslide Incident Report, DOI-NPS BAER Incident Report MS-VIP-20005.
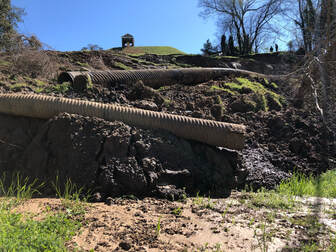
The assessment focused on evaluating landslides and erosion/mass wasting issues caused by recent heavy rainfall and flooding at Vicksburg National Military Park, Vicksburg, Mississippi during January and February 2020.
The primary objectives of the report are as follows:
The primary objectives of the report are as follows:
- Assess damages to values-at-risk caused by heavy rainfall, flooding, and landsliding.
- Prescribe immediate, cost-effective, post-event stabilization measures necessary to protect human life, property, and critical cultural and natural resources.
- Determine longer-term management needs for non-emergency restoration treatments to prevent further degradation to affected resources on lands within the park.
Stanley, T., Kirschbaum, D.B., SOBIESZCZYK, STEVEN, Jasinski, M.F., Borak, J., and S. Slaughter, 2020, Building A landslide Hazard indicator with machine learning and Landslide Surface Models. Environmental Modelling and Software
The U.S. Pacific Northwest has a history of frequent and occasionally deadly landslides caused by various factors. Using a multivariate, machine-learning approach, we combined a Pacific Northwest Landslide Inventory with a 36-year gridded hydrologic dataset from the National Climate Assessment – Land Data Assimilation System to produce a landslide hazard indicator (LHI) on a daily 0.125-degree grid. The LHI identified where and when land- slides were most probable over the years 1979–2016, addressing issues of bias and completeness that muddy the analysis of multi-decadal landslide inventories. The seasonal cycle was strong along the west coast, with a peak in the winter, but weaker east of the Cascade Range. This lagging indicator can fill gaps in the observational record to identify the seasonality of landslides over a large spatiotemporal domain and show how landslide hazard has responded to a changing climate.
Stanley, T., Kirschbaum, D.B., SOBIESZCZYK, STEVEN, Borak, J., and S. Slaughter, 2019, A landslide climate indicator from machine learning. AGU, Fall meeting
Landslides are a frequent hazard in the Pacific Northwest region of the United States, causing both substantial property damage and loss of life. Federal, state, and local agencies have responded with a portfolio of landslide research, including production of some of the nation’s best landslide inventories. Although the seasonality of landslide occurrence is well established at a few locations, historical inventories rarely include enough information on landslide timing to identify these patterns outside of metropolitan areas. Landslide models can fill this gap by determining the dates and places landslides were likely to occur, given prior knowledge about slope stability. Although physically based models can achieve this goal, the requirements for computation and accurate knowledge of initial conditions limit the feasibility of this approach for broad geographic regions. Instead, we applied xgboost, a machine-learning tool, to NCA-LDAS, a coarsely gridded hydrologic dataset, for the years 1979-2016. The model was trained and tested with data from a Pacific Northwest landslide inventory that had been compiled for this purpose from a wide range of sources that described the states of Washington and Oregon. After finalizing the model, a small number of new landslide reports were downloaded from two publicly
available landslide inventories; on these data, xgboost substantially outperformed a uniform recent-antecedent rainfall threshold. The model responds most strongly to rainfall, although terrain and antecedent conditions modulated the nature of the response. Soil moisture and soil temperature were also important predictors of landslide occurrence. The model produced a landslide hazard index (LHI) with a daily, 0.125-degree resolution and a 36-year time span. Unsurprisingly, LHI was highest along the west coast and lowest in the high “desert” regions of Oregon and Washington. At most locations, LHI peaked in winter, although the seasonal cycle was weaker east of the Cascades. Statistically significant declines in LHI were observed across most of the study area; these were paralleled by declines in the frequency of rain on snow. However, declines in LHI do not necessarily imply decreases in landslide risk. Due to increases in population across the Pacific Northwest, risk might have increased over this period. LHI functions as a quantitative and concise lagging indicator of landslide hazard. Given its success at representing the landslide climatology of the Pacific Northwest, this machine-learning approach seems appropriate for application to other large geographic regions.
available landslide inventories; on these data, xgboost substantially outperformed a uniform recent-antecedent rainfall threshold. The model responds most strongly to rainfall, although terrain and antecedent conditions modulated the nature of the response. Soil moisture and soil temperature were also important predictors of landslide occurrence. The model produced a landslide hazard index (LHI) with a daily, 0.125-degree resolution and a 36-year time span. Unsurprisingly, LHI was highest along the west coast and lowest in the high “desert” regions of Oregon and Washington. At most locations, LHI peaked in winter, although the seasonal cycle was weaker east of the Cascades. Statistically significant declines in LHI were observed across most of the study area; these were paralleled by declines in the frequency of rain on snow. However, declines in LHI do not necessarily imply decreases in landslide risk. Due to increases in population across the Pacific Northwest, risk might have increased over this period. LHI functions as a quantitative and concise lagging indicator of landslide hazard. Given its success at representing the landslide climatology of the Pacific Northwest, this machine-learning approach seems appropriate for application to other large geographic regions.
Stanley, T., Sobieszczyk, Steven, Kirschbaum, D.B., Jasinski, M., Borak, J., and S. Yatheendradas, 2017, Assessment of rainfall thresholds for landslide triggering in the Pacific Northwest - extreme short-term rainfall and long-term trends. AGU, Fall meeting
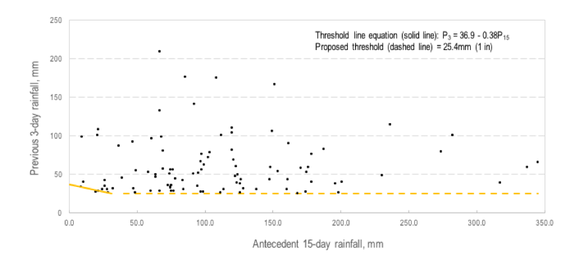
The U.S. Pacific Northwest is highly prone to frequent and potentially deadly landslides. Between 1996 and 2016, there were nearly 15,000 recorded landslides in the states of Oregon and Washington, USA. By evaluating landslide patterns at a regional scale, we hope to determine what recent and antecedent rainfall thresholds trigger localized and widespread landsliding. This study uses a newly compiled Pacific Northwest Landslide Inventory (PNLI) drawing from a suite of state and global data and leverages that against 30 years of gridded time series hydrologic data from the National Climate Assessment – Land Data Assimilation Systems (NCA-LDAS). This work evaluates the rainfall triggering relationships across this region in an effort to better characterize the patterns of changing potential landslide frequency over the recent decades. Trend analysis of extreme rainfall days within the study region suggest that since 1980 there has been a slight decreasing rate in the number of extreme rainfall days over the coastal mountains and inland Cascade mountains. However, the majority of landslides triggered within the database result from eight extreme storms within the region, suggesting that it doesn’t take many large many rain events to trigger significant failures.
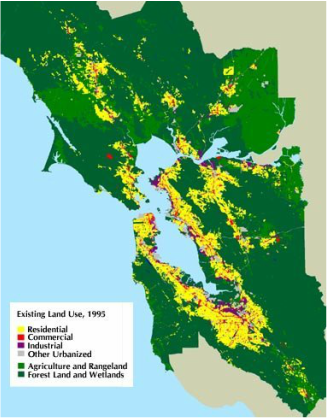
Pike, R.J., and Sobieszczyk, Steven, 2003, Process-modulated contrasts in slope exposure of landslides in San Francisco Bay Area. Abstracts, EOS. Trans. AGU, 84 (46), Fall meeting
Beaty (1956) first quantified the relation between slope exposure (aspect), the compass direction faced by a hillside normal to its contours, and landsliding in the Bay Area; he found that 78 of 112 recent small landslides east of the city of Oakland occupied NW to NE slopes. Frequency distributions of DEM-calculated aspect revisit this relation for two large sets of landslides in seven 1:24,000 quadrangles centered on Oakland: 30-m source areas of the 1,943 debris flows that formed during the severe 3-5 January 1982 storm (Wieczorek et al., 1988), and 116,360 30-m grid cells on 6714 pre-1970 deep-seated landslides of various types exclusive of debris flows (Nilsen, 1975; Pike et al., 2001). Normalizing each distribution of landslide aspect (in percent, in 10o intervals) by the aspect of all slopes in the study area above 75 m in elevation and steeper than 3o corrects for the excess of NE and SW slopes imparted by the NW-SE grain of local topography. Both resulting distributions are skewed, but in directions that reflect contrasting processes of landsliding. The differences suggest that any incorporation of slope aspect into landslide susceptibility in the Bay area must reflect specific types of failure. The deep-seated landslides favor ENE slopes and are deficient on southerly slopes. The prevailing explanation for this observation was first proposed in the study area by Beaty (1956). Compared to steep S-SW slopes, exposed to afternoon sun at near-normal angles of incidence (northern hemisphere), N-NE slopes are more shaded, sustain less evapo-transpiration, and thus accumulate more and deeper moisture over extended periods-conditions favoring deep-seated failure triggered by prolonged rainfall or seismic shaking. Such conditions are unlikely to have controlled location of the 1982 debris flows, which are conspicuously deficient on NE slopes but strongly favor S-SSE slopes. One explanation is wind-driven rainfall, which may have delivered moisture preferentially to steep southerly slopes. This hypothesis is consistent with the 155o median of 33 hourly measurements of wind direction during the January 1982 rainstorm at nearby Oakland International Airport, where recorded wind speed averaged 19 kts. Alternative explanations and other Bay Area locations remain to be explored.
Pike, R.J., and Sobieszczyk, Steven, 2008, Soil slip/debris flow localized by site attributes and wind-driven rain in the San Francisco Bay region storm of January 1982: Geomorphology, v. 94, no. 2, p. 290-313
GIS analysis at 30-m resolution reveals that effectiveness of slope-destabilizing processes in the San Francisco Bay area varies with compass direction. Nearly half the soil slip/debris flows mapped after the catastrophic rainstorm of 3–5 January 1982 occurred on slopes that face S to WSW, whereas fewer than one-quarter have a northerly aspect. Azimuthal analysis of hillside properties for susceptible terrain near the city of Oakland suggests that the skewed aspect of these landslides primarily reflects vegetation type, ridge and valley alignment, and storm–wind direction. Bedrock geology, soil expansivity, and terrain height and gradient also were influential but less so; the role of surface curvature is not wholly resolved. Normalising soil-slip aspect by that of the region's NNW-striking topography shifts the modal azimuth of soil-slip aspect from SW to SE, the direction of origin of winds during the 1982 storm—but opposite that of the prevailing WNW winds. Wind from a constant direction increases rainfall on windward slopes while diminishing it on leeward slopes, generating a modelled difference in hydrologically effective rainfall of up to 2:1 on steep hillsides in the Oakland area. This contrast is consistent with numerical simulations of wind-driven rain and with rainfall thresholds for debris-flow activity. We conclude that storm winds from the SE in January 1982 raised the vulnerability of the Bay region's many S-facing hillsides, most of which are covered in shallow-rooted shrub and grass that offer minimal resistance to soil slip. Wind-driven rainfall also appears to have controlled debris-flow location in a major 1998 storm and probably others. Incorporating this overlooked influence into GIS models of debris-flow likelihood would improve predictions of the hazard in central California and elsewhere.
Pike, R.J., and Sobieszczyk, Steven, 2008, Susceptibility to deep-seated landsliding modelled for the Oakland-Berkeley Area, Northern California: in Pike, R.J., and Graymer, R.W., eds., Multiple landslide-hazard scenarios modeled for the Oakland-Berkeley Area, Northern California: U.S. Geological Survey Scientific Investigations Report 2007-5196, p. 15-26, 1 plate
In the San Francisco Bay region, either prolonged rainfall or a major earthquake can trigger large, deep-seated landslides, which differ from debris flows and other small, shallow failures. The varying likelihood that hillsides in the Oakland-Berkeley area might incur large landslides is mapped by statistically combining maps of old and recently active landslides with maps of geology and ground slope. Computed as a continuous variable at 30-m resolution, an index of relative susceptibility to deep-seated landsliding is estimated for individual geologic map units as the areal percentage of terrain occupied by old landslides, adjusted by slope gradient and the spatial frequency of recent landslides. The resulting susceptibility map indicates that, although most of the Oakland- Berkeley area is unlikely to host a deep-seated landslide, over one-fifth of the area of residential housing on hillsides has substantial potential for this type of slope instability. Using similar methods, susceptibility maps could be prepared for the entire San Francisco Bay region or, moreover, anywhere the three components —geology, landslide locations, and slope gradient —are available as digital spatial data. Such susceptibility maps have various applications to public policy aimed at mitigating the landslide hazard.
Schmidt, K.M., and Sobieszczyk, Steven, 2008, Susceptibility to shallow landsliding modeled for the Oakland-Berkeley Area, Northern California: in Pike, R.J., and Graymer, R.W., eds., Multiple landslide-hazard scenarios modeled for the Oakland-Berkeley Area, Northern California: U.S. Geological Survey Scientific Investigations Report 2007-5196, p. 27-31, 2 plates
The susceptibility of shallow soil to landsliding by large-magnitude rain storms is estimated for upland hillsides in the Oakland-Berkeley area of northern California, from geographic information system (GIS) analyses of digital elevation models at 5- and 10-m resolution. The regional-scale prediction of source regions for rainfall-induced shallow landslides, which is based on the SHALSTAB model, highlights the topographic influence on initiation sites, which commonly are areas of steep, convergent topography. This broad-scale estimation does not account for such site-specific variability as material properties, vegetation cover, or local hydrologic response; however, on the basis of topographic factors, it does denote the relative spatial density of potential initiation sites, which can mobilize into destructive, fast-moving debris flows.
Burns, S.F., Pirot, Rachel, Sobieszczyk, Steven, and Williams, Kendra, 2009, Massive Debris Flow Events on Pacific Northwest Volcanoes, November, 2006: As the Climate Changes, More Debris Flow Events to Come: Geological Society of America Abstracts with Programs, Vol. 41, No. 7, p. 716
During the second week of November, 2006 a warm, wet air mass, locally called the “Pineapple Express” hit Oregon and Washington and dumped over 50 cm rain onto the volcanoes within 36 hours before there was snow cover. It mobilized the abundant sediment on the slopes of the volcanoes and created many devastating debris flows. The amount of available sediment on the slopes has increased in recent years as glaciers have retreated, exposing the inside of lateral moraines. Mt. Hood was the most devastated with 7 of 11 major drainages producing significant debris flows. Eliot Creek and White River produced extensive debris flows that measured well over 2 million cubic meters each and closed major highways in the region for weeks. A large delta formed in the Columbia River at Hood River resulting from the debris flows. At Mt. Rainier the southwest drainages were hit hard. Kautz Creek rerouted. The Nisqually River enlarged greatly in size and almost undercut the Longmire emergency response headquarters. The Sunshine Campground disappeared. At Mt. St. Helens, the road to Lava Canyon was washed out in two places. Milk Creek was the major debris flow on Mt. Jefferson. On Mt. Adams, many debris flows were generated in the drainages of Salt Creek, Adams Creek and the Big Muddy. The largest debris flow collapsed the moraine at Crofton Ridge. As the climate continues to change, we will see more large debris flows as these air masses arrive before snow cover can shield their impact on the volcanoes.
Sobieszczyk, Steven, Uhrich, M.A., Piatt, D.R., and Bragg, H.M., 2008, Analysis of Geomorphic and Hydrologic Characteristics of Mount Jefferson Debris Flow, Oregon, November 6, 2006: U.S. Geological Survey Scientific Investigations Report 2008-5204, 19p.
Sobieszczyk, Steven, Uhrich, M.A., Piatt, D.R., and Bragg, H.M., 2009, Analysis of Geomorphic and Hydrologic Characteristics of Mount Jefferson Debris Flow, Oregon, November 6, 2006: Geological Society of America Abstracts with Programs, Vol. 41, No. 7, p. 499
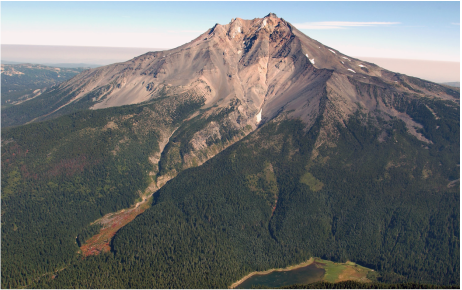
On November 6, 2006, a rocky debris flow surged off the western slopes of Mount Jefferson into the drainage basins of Milk and Pamelia Creeks in Oregon. This debris flow was not a singular event, but rather a series of surges of both debris and flooding throughout the day. The event began during a severe storm that brought warm temperatures and heavy rainfall to the Pacific Northwest. Precipitation measurements near Mount Jefferson at Marion Forks and Santiam Junction showed that more than 16.1 centimeters of precipitation fell the week leading up to the event, including an additional 20.1 centimeters falling during the 2 days afterward. The flooding associated with the debris flow sent an estimated 15,500 to 21,000 metric tons, or 9,800 to 13,000 cubic meters, of suspended sediment downstream, increasing turbidity in the North Santiam River above Detroit Lake to an estimated 35,000 to 55,000 Formazin Nephelometric Units. The debris flow started small as rock and ice calved off an upper valley snowfield, but added volume as it eroded weakly consolidated deposits from previous debris flows, pyroclastic flows, and glacial moraines. Mud run-up markings on trees indicated that the flood stage of this event reached depths of at least 2.4 meters. Velocity calculations indicate that different surges of debris flow and flooding reached 3.9 meters per second. The debris flow reworked and deposited material ranging in size from sand to coarse boulders over a 0.1 square kilometer area, while flooding and scouring as much as 0.45 square kilometer. Based on cross-sectional transect measurements recreating pre-event topography and other field measurements, the total volume of the deposit ranged from 100,000 to 240,000 cubic meters.
Sobieszczyk, Steven, 2012, Instream Turbidity Monitoring Used to Assess Landslide Hazards in the Western Cascades: National Water Quality Monitoring Council, National Meeting, Portland, OR
Sobieszczyk, Steven, and Burns, S.F., 2013, Tracking Landslides: Using Instream Monitoring Techniques to Investigate Landslide Hazards in the Western Cascades: Oregon Academy of Science, Annual Meeting, March 2013, Geology Section
Landslides are a common geologic feature across much of the western Cascades in Oregon and Washington. The combination of heavy seasonal rainfall, deeply weathered soils, and steep slopes in the region make hillsides highly susceptible to slope failure. Whether landslides materialize as shallow, rapidly moving debris flows, or slow- moving, deep-seated earthflows – landslide activity poses a risk to people and the environment, including increased sediment transport in streams, degradation of aquatic habitat, damage to infrastructure, or even loss of life. Because landslides often flow into mountain valleys, they can quickly supply a large amount of sediment to local streams and rivers. This increased sediment load proves especially problematic for water providers in rivers that serve as the primary source of drinking water for nearby communities because highly turbid water requires costly treatment prior to distribution and consumption. Using water-quality monitoring, it is possible to detect periods of increased turbidity and relate these measurements to landslide source locations. Once a connection is established between a known landslide and a water-quality monitor, instream turbidity then can be used to highlight periods of landslide reactivation and quantify potential erosion rates from the landslide. This methodology has been used in the North Santiam River Basin to monitor changes in sediment input from landslides and determine how land management and climate may alter landslide frequency and magnitude. For example, on November 6, 2006, a large debris flow mobilized from the western slopes of Mount Jefferson into the Milk Creek watershed. The debris flow deposited boulder-sized material over a 0.45 km2 area and sent 15,000 metric tons of suspended sediment downstream. The suspended sediment increased downstream turbidity in the North Santiam River to an estimated peak value of 30,000 Formazin Nephelometric Units. This was the third such event from Mount Jefferson since 2001. Other landslides, such as the Evans Creek Landslide, routinely contribute over 1,000 metric tons of sediment each year to the North Santiam River. Because sediment flux from landslide source areas is not dependent on stream discharge, the turbidity–streamflow relation is much different for landslide sources than that for precipitation-driven surface erosion.


