Hydrology.
Naturally, I tracked the dirt from those pesky landslides into the streams. Then I started to investigate other stuff in the water...with the help of others, of course. This is what I've learned so far.
HYDROLOGY
Sobieszczyk, Steven, 2022, How USGS gages are used in flood forecasting: U.S. Geological Survey FACT SHEET 2022-3076.
The U.S. Geological Survey (USGS) operates an extensive nationwide network of stream, rain, and groundwater gages. These instruments are used to monitor how much water there is across the Nation at any given moment. Stream data are collected at streamgages every 15 minutes, transmitted to USGS servers, and updated online in real time. To improve awareness of current water conditions and possible flooding, stream data are combined with rain data collected at nearby USGS rain gages. The National Weather Service uses the USGS stream and rain data to forecast when flooding might occur and issue flood warnings.
Carpenter, K.D., Czuba, C.R., Magirl, C.S., Marineau, M.D., Sobieszczyk, Steven, Czuba, J.A., and Keith, M.K., 2012, Geomorphic setting, aquatic habitat, and water-quality conditions of the Molalla River, Oregon, 2009–10: U.S. Geological Survey Scientific Investigations Report 2012–5017, 78 p.

This report presents results from a 2009–10 assessment of the lower half of the Molalla River. The report describes the geomorphic setting and processes governing the physical layout of the river channel and evaluates changes in river geometry over the past several decades using analyses of aerial imagery and other quantitative techniques.
O’CONNOR, J.E., WALLICK, J.R., SOBIESZCZYK, STEVEN, CANNON, CHARLES, AND ANDERSON, S.W., 2009, PRELIMINARY ASSESSMENT OF VERTICAL STABILITY AND GRAVEL TRANSPORT ALONG THE UMPQUA RIVER, SOUTHWESTERN OREGON: U.S. GEOLOGICAL SURVEY OPEN-FILE REPORT 2009-1010, 40 P.
This report addresses physical channel issues related to instream gravel mining on the Umpqua River and its two primary tributaries, the North and South Umpqua Rivers. This analysis constitutes a “Phase I” investigation, as designated by an interagency team cochaired by the U.S. Army Corps of Engineers, Portland District, and the Oregon Department of State Lands to address instream gravel mining issues across Oregon. Phase I analyses rely primarily on existing datasets and cursory analysis to determine the vertical stability of a channel to ascertain whether a particular river channel is aggrading, degrading, or at equilibrium. Additionally, a Phase I analysis identifies other critical issues or questions pertinent to physical channel conditions that may be related to instream gravel mining activities.
WATER QUALITY
Smith, C.D., Rounds, S.A., and Orzol, L.L., 2018, Klamath River Basin water-quality data: U.S. Geological Survey Fact Sheet 2018-3031, 4 p., COMPILED BY SOBIESZCZYK, STEVEN
The Klamath River Basin stretches from the mountains and inland basins of south-central Oregon and northern California to the Pacific Ocean, spanning multiple climatic regions and encompassing a variety of ecosystems. Water quantity and water quality are important topics in the basin, because water is a critical resource for farming and municipal use, power generation, and for the support of wildlife, aquatic ecosystems, and endangered species. Upper Klamath Lake is the largest freshwater lake in Oregon (112 square miles) and is known for its seasonal algal blooms. The Klamath River has dams for hydropower and the upper basin requires irrigation water to support agriculture and grazing. Multiple species of endangered fish inhabit the rivers and lakes, and the marshes are key stops on the Pacific flyway for migrating birds. For these and other reasons, the water resources in this basin have been studied and monitored to support their management distribution.
Sobieszczyk, Steven, Bragg, H.M., and Uhrich, M.A., 2015, Water-quality conditions and suspended-sediment transport in the Wilson and Trask Rivers, northwestern Oregon, water years 2012–14: U.S. Geological Survey Scientific Investigations Report 2015-5109, 32 p.

In October 2011, the U.S. Geological Survey began investigating and monitoring water-quality conditions and suspended-sediment transport in the Wilson and Trask Rivers, northwestern Oregon. Water temperature, specific conductance, turbidity, and dissolved oxygen were measured every 15–30 minutes in both streams using real-time instream water-quality monitors. In conjunction with the monitoring effort, suspended-sediment samples were collected and analyzed to model the amount of suspended sediment being transported by each river. Over the course of the 3-year study, which ended in September 2014, nearly 600,000 tons (t) of suspended-sediment material entered Tillamook Bay from these two tributaries. Each year of the study, the Wilson River transported between 80,300 and 240,000 t of suspended sediment, while the Trask River contributed between 28,200 and 69,900 t. The suspended-sediment loads observed during the study were relatively small because streamflow conditions were routinely lower than normal between October 2011 and September 2014. Only one storm had a recurrence interval between a 2- and 5-year event. Every other storm produced streamflows equivalent to what would be classified as a 1- or 2-year event. Because most sediment moves during high flows, the lack of heavy rainfall and elevated streamflows muted any high sediment loads. Along with assessing suspended-sediment transport, the U.S. Geological Survey also monitored instream water quality. This monitoring was used to track instream conditions and relate them to water temperature, dissolved oxygen, and sedimentation issues for the Wilson and Trask Rivers. Stream temperatures in the Wilson and Trask Rivers exceeded the temperature standard for cold-water habitat. Water temperatures at both streams exceeded the standard for more than 30 percent of the year, as stream temperatures increased above the seasonal 13 degrees Celsius (°C) (seasonal core cold-water habitat) and 16 °C (salmon and steelhead [Oncorhynchus mykiss] spawning) thresholds. Conversely, dissolved oxygen concentrations rarely decreased to less than the absolute water-quality criterion of 8 milligrams per liter for cold-water streams.
Carpenter, K.D., Sobieszczyk, Steven, Arnsberg, A.J., and Rinella, F.A., 2008, Pesticide occurrence and distribution in the lower Clackamas River Basin, Oregon, 2000-2005: U.S. Geological Survey Scientific Investigations Report 2008-5027, 97p.
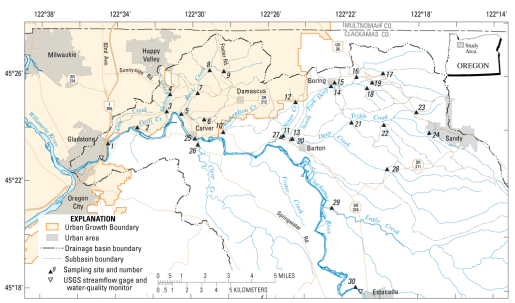
Pesticide occurrence and distribution in the lower Clackamas River basin was evaluated in 2000–2005, when 119 water samples were analyzed for a suite of 86–198 dissolved pesticides. Sampling included the lower-basin tributaries and the Clackamas River mainstem, along with paired samples of pre- and post-treatment drinking water (source and finished water) from one of four drinking water-treatment plants that draw water from the lower river. Most of the sampling in the tributaries occurred during storms, whereas most of the source and finished water samples from the study drinking-water treatment plant were obtained at regular intervals, and targeted one storm event in 2005. Although most of the 51 current-use pesticides detected have multiple uses, 48 (or 94 percent) can be used on agricultural crops. Ninety-two percent can be used on nursery or floriculture crops; about one-half are commonly used on either lawns and landscaping in urban areas (57 percent), on golf courses (49 percent), along roads and right-of-ways (45 percent), and some can be used on forestland (7 percent).
Goldman, J.H., Rounds, S.A., Keith, M.K., Sobieszczyk, Steven, 2014, Investigating organic matter in Fanno Creek, Oregon, Part 3 of 3—Identifying and quantifying sources of organic matter to an urban stream: J. Hydrol., v. 519D, p. 3028-3041
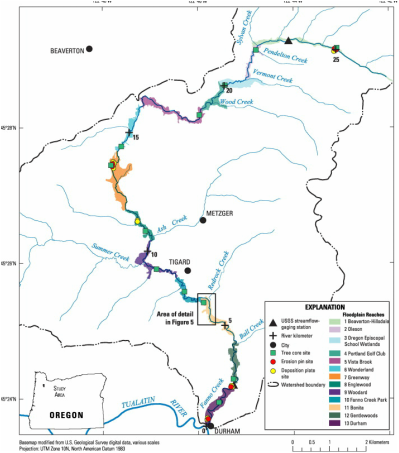
The sources, transport, and characteristics of organic matter (OM) in Fanno Creek, an urban stream in northwest Oregon, were assessed and quantified using: (1) optical instruments to calculate transported loads of dissolved, particulate, and total organic carbon, (2) fluorescence spectroscopy and stable isotope ratios (δ13C, δ15N) to elucidate sources and chemical properties of OM throughout the basin, and (3) synoptic sampling to investigate seasonal and hydrologic variations in the characteristics and quantity of OM. Results from this study indicate that of the roughly 324 (±2.9%) metric tons (tonnes, t) of organic carbon exported from the basin during March 2012 to March 2013, most of the OM in Fanno Creek was dissolved (72%) and was present year-round at concentrations exceeding 3–4 milligrams of carbon per liter, whereas particulate carbon typically was mobilized and transported only by higher-flow conditions. The isotopic and fluorescence characteristics of Fanno Creek OM indicate that the carbon originates primarily from terrestrial inputs, most likely riparian vegetative biomass that enters the stream via litterfall and overland transport and then travels through the system episodically as a result of hydrologic processes. The amount of OM exported from the Fanno Creek drainage over the course of a year in this study is consistent with previous estimates of annual riparian litterfall in or near the creek. Although the creek channel is actively eroding, most bank material has too little OM for that to be a dominant source of OM to the stream. Fluorescence data revealed that the OM contains primarily humic and fulvic-like components that become less aromatic as the OM moves downstream. The most significant seasonal variation was associated with OM transported in the first storms of the autumn season (fall flush). That material was characteristically different, with a larger fraction of microbially derived OM that probably resulted from an accumulation of easy-to-mobilize and decomposing material in the streambed during previous months of summertime low-flow conditions. The first fall flush produced the highest concentrations of OM of the entire year, and the resulting load of mobilized and decomposing OM resulted in a significant oxygen demand immediately downstream in the Tualatin River.
Piatt, D.R., Johnston, M.W., Bragg, H.M., Brooks, A.M., Sobieszczyk, Steven, and Uhrich, M.A., 2011, Water-quality in the North Santiam River basin, Oregon—Comparison of water-quality data for water year 2007 with the preceding period of record: U.S. Geological Survey Open-File Report 2011–1008, 75 p.
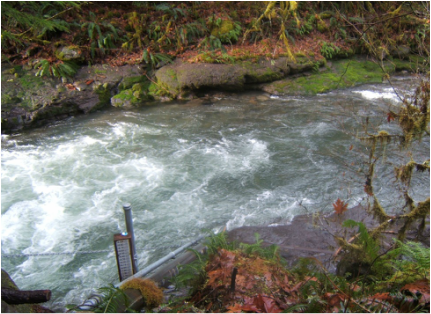
Water-quality data have been collected in the North Santiam River basin since 1998. During water year 2007, eight monitoring stations were operated throughout the basin. Streamflow data were collected at all but one of these sites. This report presents a comparison of the water-quality and streamflow data collected at each monitoring station from monitor installation through water year 2006 with the data for water year 2007. Data were compiled monthly and annually to identify extreme values by season and for entire periods of study.
Sullivan, A.B., Rounds, S.A., Sobieszczyk, Steven, and Bragg, H.M., 2007, Modeling hydrodynamics, water temperature, and suspended sediment in Detroit Lake, Oregon: U.S. Geological Survey Scientific Investigations Report SIR 2007-5008, 40p.
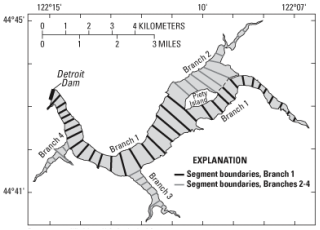
Detroit Lake is a large reservoir on the North Santiam River in west-central Oregon. Water temperature and suspended sediment are issues of concern in the river downstream of the reservoir. A CE-QUAL-W2 model was constructed to simulate hydrodynamics, water temperature, total dissolved solids, and suspended sediment in Detroit Lake. The model was calibrated for calendar years 2002 and 2003, and for a period of storm runoff from December 1, 2005, to February 1, 2006. Input data included lake bathymetry, meteorology, reservoir outflows, and tributary inflows, water temperatures, total dissolved solids, and suspended sediment concentrations. Two suspended sediment size groups were modeled: one for suspended sand and silt with particle diameters larger than 2 micrometers, and another for suspended clay with particle diameters less than or equal to 2 micrometers. The model was calibrated using lake stage data, lake profile data, and data from a continuous water-quality monitor on the North Santiam River near Niagara, about 6 kilometers downstream of Detroit Dam. The calibrated model was used to estimate sediment deposition in the reservoir, examine the sources of suspended sediment exiting the reservoir, and examine the effect of the reservoir on downstream water temperatures.
Wise, D.R., Rinella, F.A., Rinella, J.F., Fuhrer G.J., Embrey, S.S., Clark, G.M., Schwarz, G.E., and Sobieszczyk, Steven, 2007, Nutrient and suspended-sediment transport and trends in the Columbia River and Puget Sound Basins, 1993-2003: U.S. Geological Survey Scientific Investigations Report 2007-5186, 116p.
This study focused on three areas that might be of interest to water-quality managers in the Pacific Northwest: (1) annual loads of total nitrogen (TN), total phosphorus (TP) and suspended sediment (SS) transported through the Columbia River and Puget Sound Basins, (2) annual yields of TN, TP, and SS relative to differences in landscape and climatic conditions between subbasin catchments (drainage basins), and (3) trends in TN, TP, and SS concentrations and loads in comparison to changes in landscape and climatic conditions in the catchments. During water year 2000, an average streamflow year in the Pacific Northwest, the Columbia River discharged about 570,000 pounds per day of TN, about 55,000 pounds per day of TP, and about 14,000 tons per day of SS to the Pacific Ocean. The Snake, Yakima, Deschutes, and Willamette Rivers contributed most of the load discharged to the Columbia River. Point-source nutrient loads to the catchments (almost exclusively from municipal wastewater treatment plants) generally were a small percentage of the total in-stream nutrient loads; however, in some reaches of the Spokane, Boise, Walla Walla, and Willamette River Basins, point sources were responsible for much of the annual in-stream nutrient load. Point-source nutrient loads generally were a small percentage of the total catchment nutrient loads compared to nonpoint sources, except for a few catchments where point-source loads comprised as much as 30 percent of the TN load and as much as 80 percent of the TP load. The annual TN and TP loads from point sources discharging directly to the Puget Sound were about equal to the annual loads from eight major tributaries.
Wise, D.r., Johnson, H., and Sobieszczyk, Steven, 2009, Relating Surface-Water Nutrients in the Pacific Northwest to Watershed Attributes Using the USGS SPARROW Model: ABSTRACTS, Water and Land Use in the Pacific Northwest Conference, Skamania, Washington
The USGS SPARROW model (SPAtially Referenced Regression On Watershed attributes) was used in combination with the 1:500,000 scale River Reach File 1 (RF1) stream network to predict the long-term, average loads, yields, and concentrations of total nitrogen and total phosphorus for stream reaches located in the Pacific Northwest (the Columbia basin, Puget Sound basin, and Pacific drainages of Oregon and Washington), and to identify the important sources and watershed properties that control the transport of nutrients through these stream reaches. The modeling results were used to identify stream reaches that exceeded the suggested U.S. Environmental Protection Agency reference concen- trations for nutrient enrichment, to compare the locations of these reaches with those that have been identified by state regulatory agencies as impaired because of nutrient enrichment (based on the state 303(d) lists), and to determine the relative contribution of different source categories to the annual nutrient load in these impaired reaches. The results from this analysis will be linked to an online deci- sion support system that regional water-quality managers and other stakeholders can use to predict changes in water-quality conditions under different management scenarios, assess water-quality con- ditions where no water-quality results are available, and design water-quality monitoring programs.
Carpenter, K.D., Snyder, D.T., Duff, J.H., Triska, F.J., Lee, K.K., Avanzino, R.J., and Sobieszczyk, Steven, 2009, Hydrologic and water-quality conditions during restoration of the Wood River Wetland, upper Klamath River basin, Oregon, 2003–05: U.S. Geological Survey Scientific Investigations Report 2009-5004, 66 p.
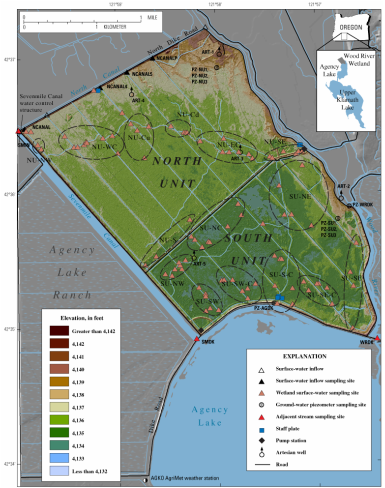
Restoring previously drained wetlands is a strategy currently being used to improve water quality and decrease nutrient loading into Upper Klamath Lake, Oregon. In this 2003–05 study, ground- and surface-water quality and hydrologic conditions were characterized in the Wood River Wetland. Nitrogen and phosphorus levels, primarily as dissolved organic nitrogen and ammonium (NH4) and soluble reactive phosphorus (SRP), were high in surface waters. Dissolved organic carbon concentrations also were elevated in surface water, with median concentrations of 44 and 99 milligrams of carbon per liter (mg-C/L) in the North and South Units of the Wood River Wetland, respectively, reaching a maximum of 270 mg-C/L in the South Unit in late autumn. Artesian well water produced NH4 and SRP concentrations of about 6,000 micrograms per liter (µg/L), and concentrations of 36,500 µg-N/L NH4 and 4,110 µg-P/L SRP in one 26–28 ft deep piezometer well. Despite the high ammonium concentrations, the nitrate levels were moderate to low in wetland surface and ground waters.


